
GlobalTrack
GlobalTrack is a comprehensive pipeline pig tracking and passage detection solution designed for the oil and gas industry. This case study documents my role in creating a 0→1 product that transformed how pipeline operators track, monitor, and report on pipeline inspection gauge (PIG) operations across onshore, offshore, and subsea environments.
- My role
- Product Designer
- Timeline
- Nov 2020 – Feb 2021 (2 months)
- Team
- Product Manager, Software Engineer, Head of Product

Challenge
Industry context
Pipeline inspection gauges (PIGs) are critical tools in the oil and gas industry, used to clean, inspect, and maintain pipelines without interrupting flow. However, tracking these devices as they travel through miles of pipeline presented significant challenges:
- Fragmented Systems: Pipeline tracking was previously managed through disconnected spreadsheets, paper logs, and manual processes
- Data Inconsistency: Information was often duplicated, outdated, or incomplete across different tracking methods
- Limited Visibility: Real-time location tracking was imprecise, leading to operational inefficiencies
- Compliance Risks: Inadequate documentation created potential regulatory compliance issues
User needs
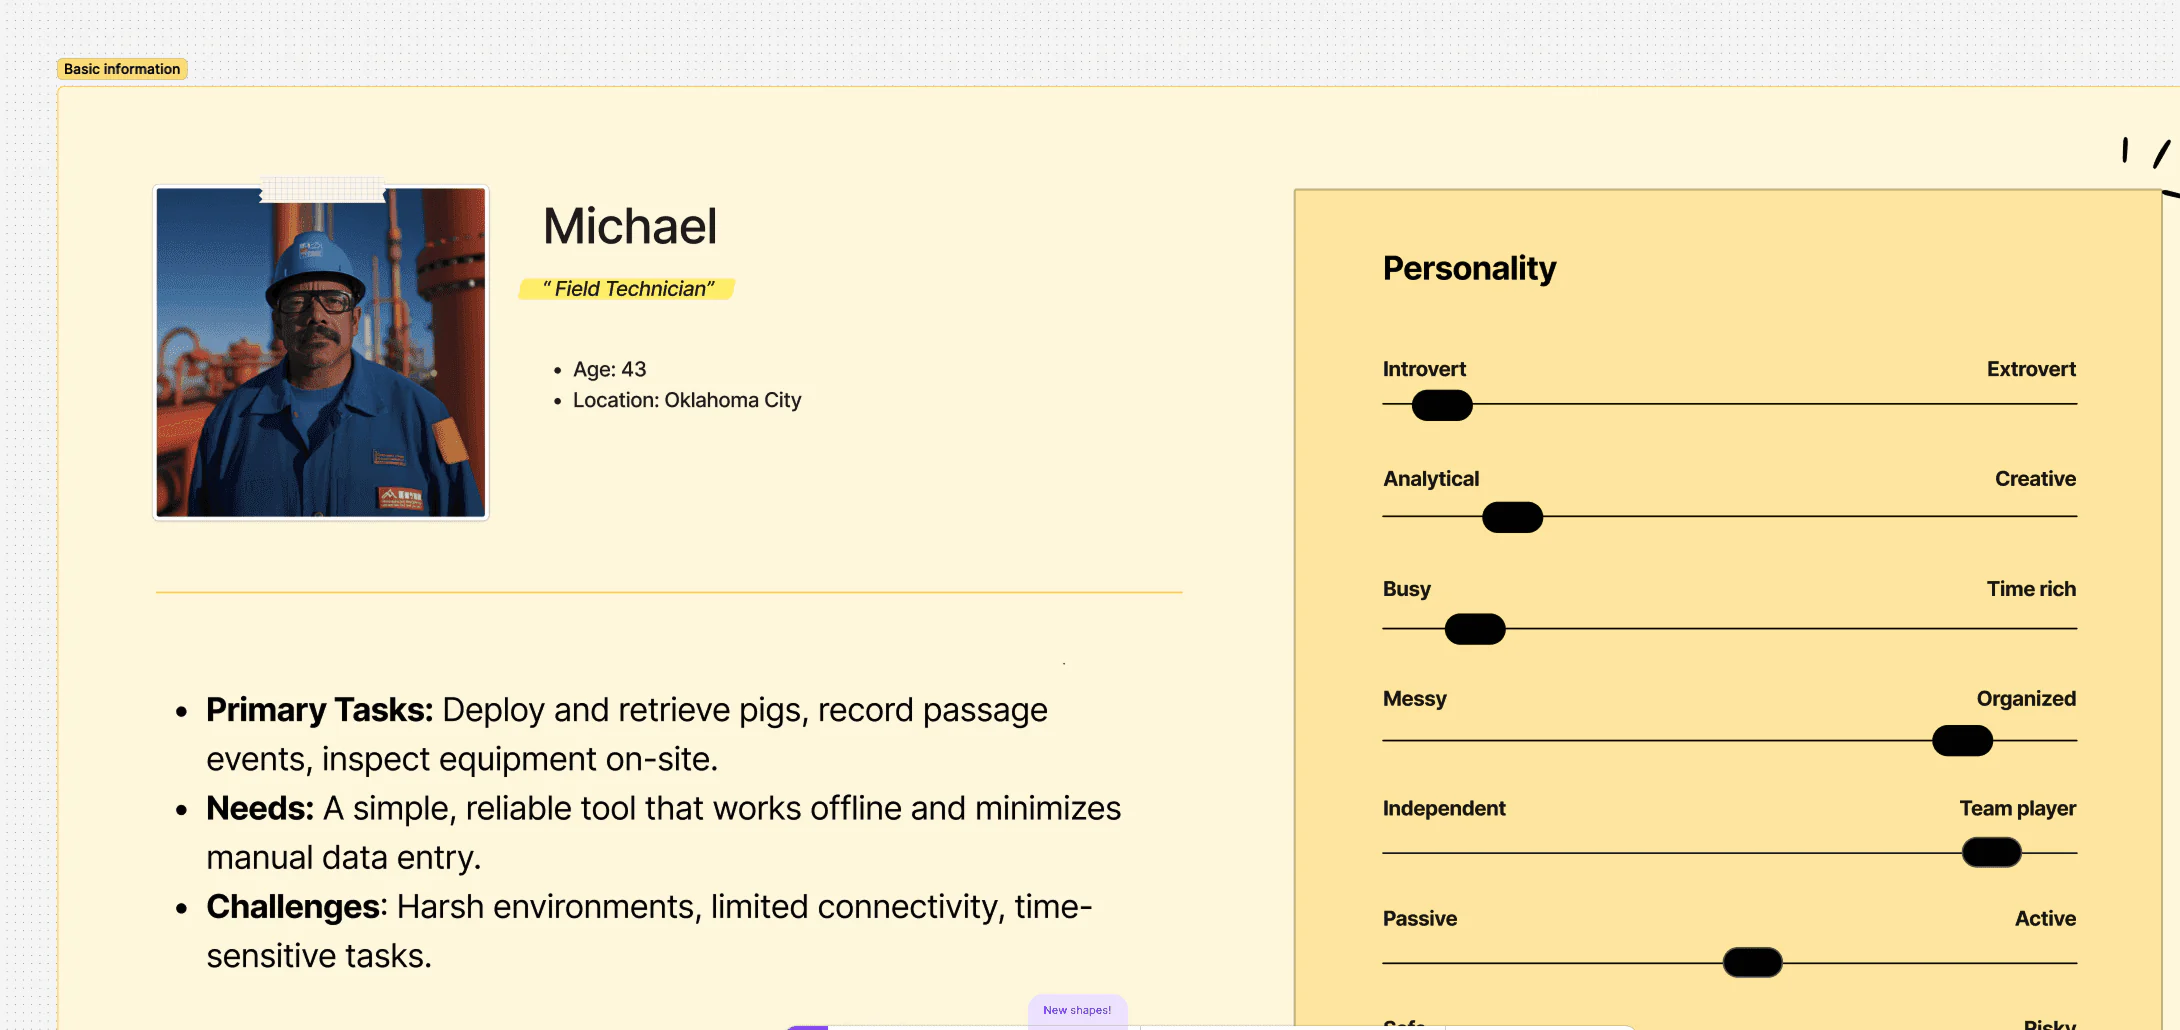
Through extensive field research and stakeholder interviews, we identified several critical user needs:
- Field Operators needed reliable tracking that works in remote locations with limited connectivity
- Survey Teams needed precise GPS coordinate recording with minimal manual input
- Project Managers needed a comprehensive overview of all pipeline projects and their status
- Compliance Officers needed standardized reporting that meets regulatory requirements
Design process
Ideation & exploration
I partnered with the Product Owner to translate business requirements into user-centered design solutions:
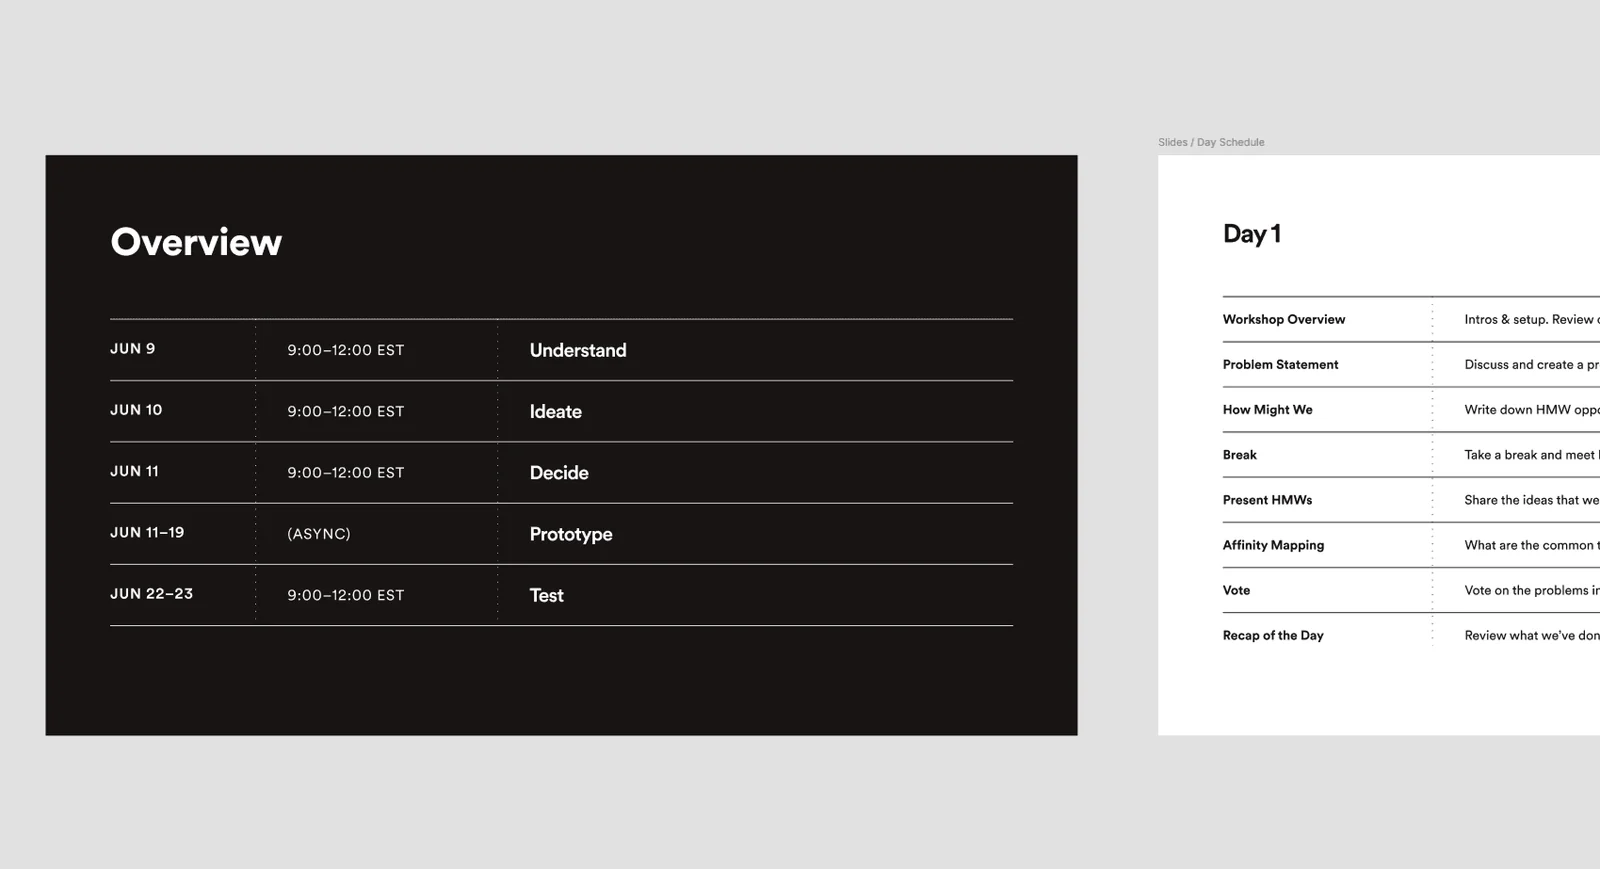
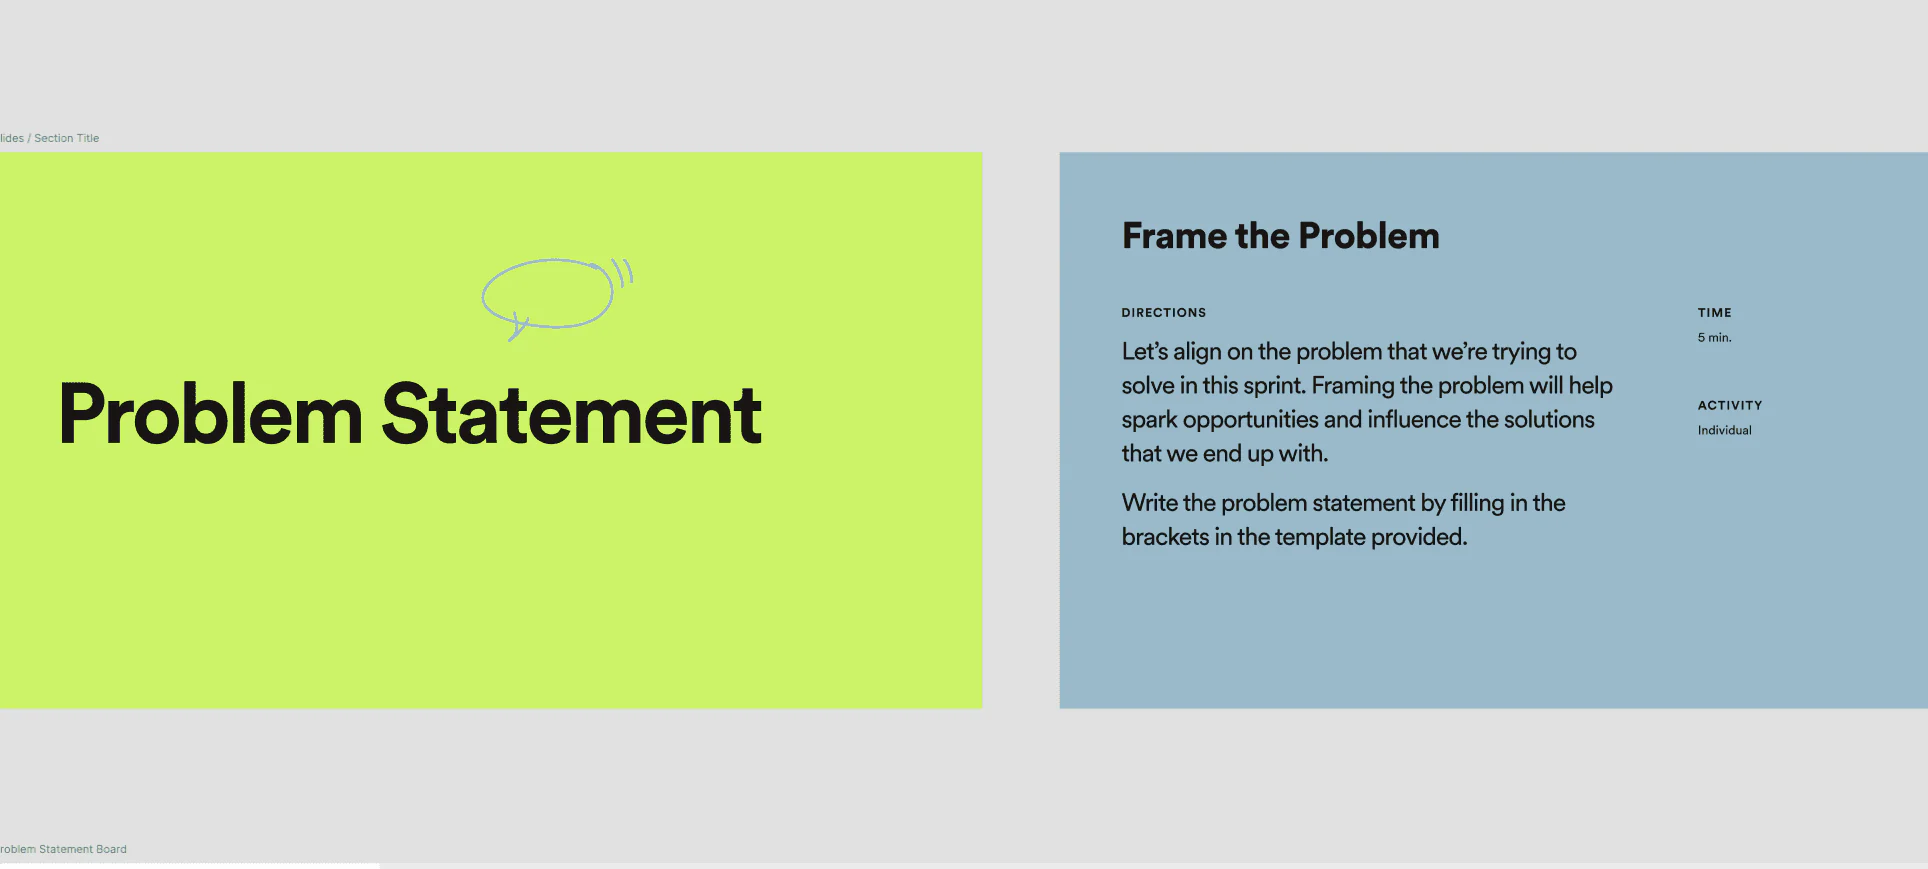
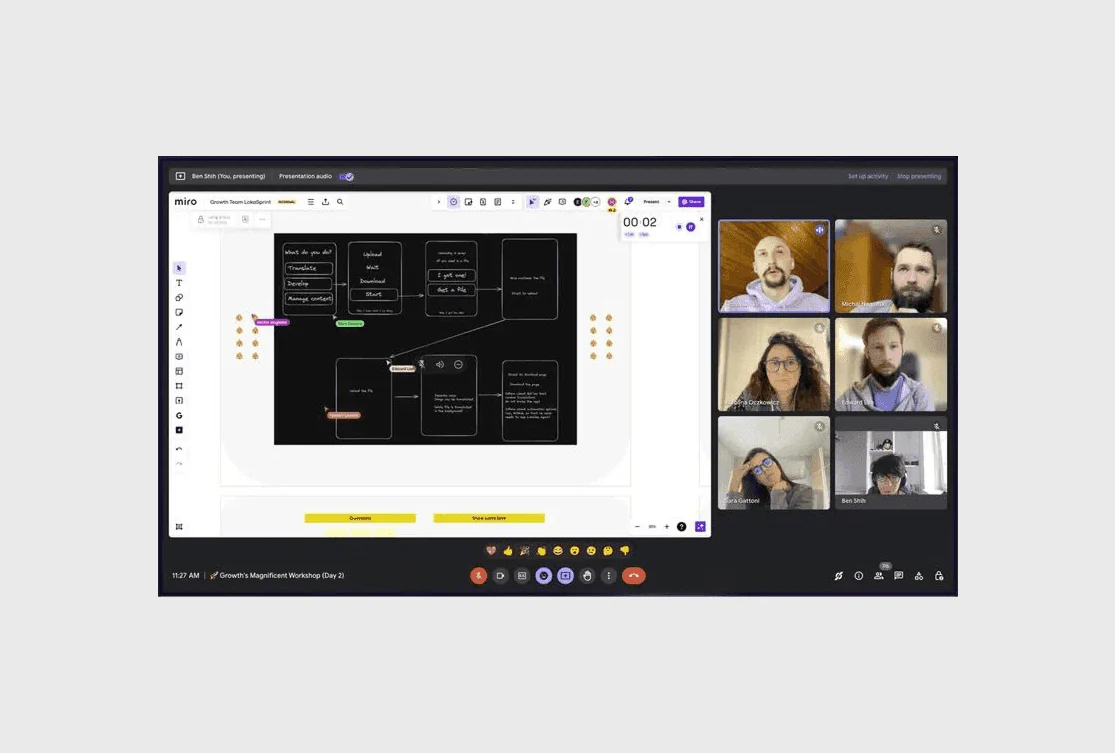
- Collaborative Workshops: Ran 3 ideation sessions with cross-functional teams to generate solution concepts
- User Flow Mapping: Created comprehensive user flows for key scenarios, identifying potential pain points
- Feature Prioritization: Used the MoSCoW method (Must have, Should have, Could have, Won’t have) to prioritize features based on user needs and technical feasibility
Design decisions & trade-offs
- Offline Functionality: Prioritized robust offline mode over feature richness to ensure reliability in remote locations.
- Simplified UI: Chose simpler UI solutions over complex interactions to optimize for field conditions and low training requirements.
- Data Synchronization: Designed a system that would store and sync data when connectivity was restored, ensuring no data loss.
Solution
Seven surfaces, built around one constraint: a field operator holding a tablet in the middle of a pipeline right-of-way, with no signal and no time to learn anything.
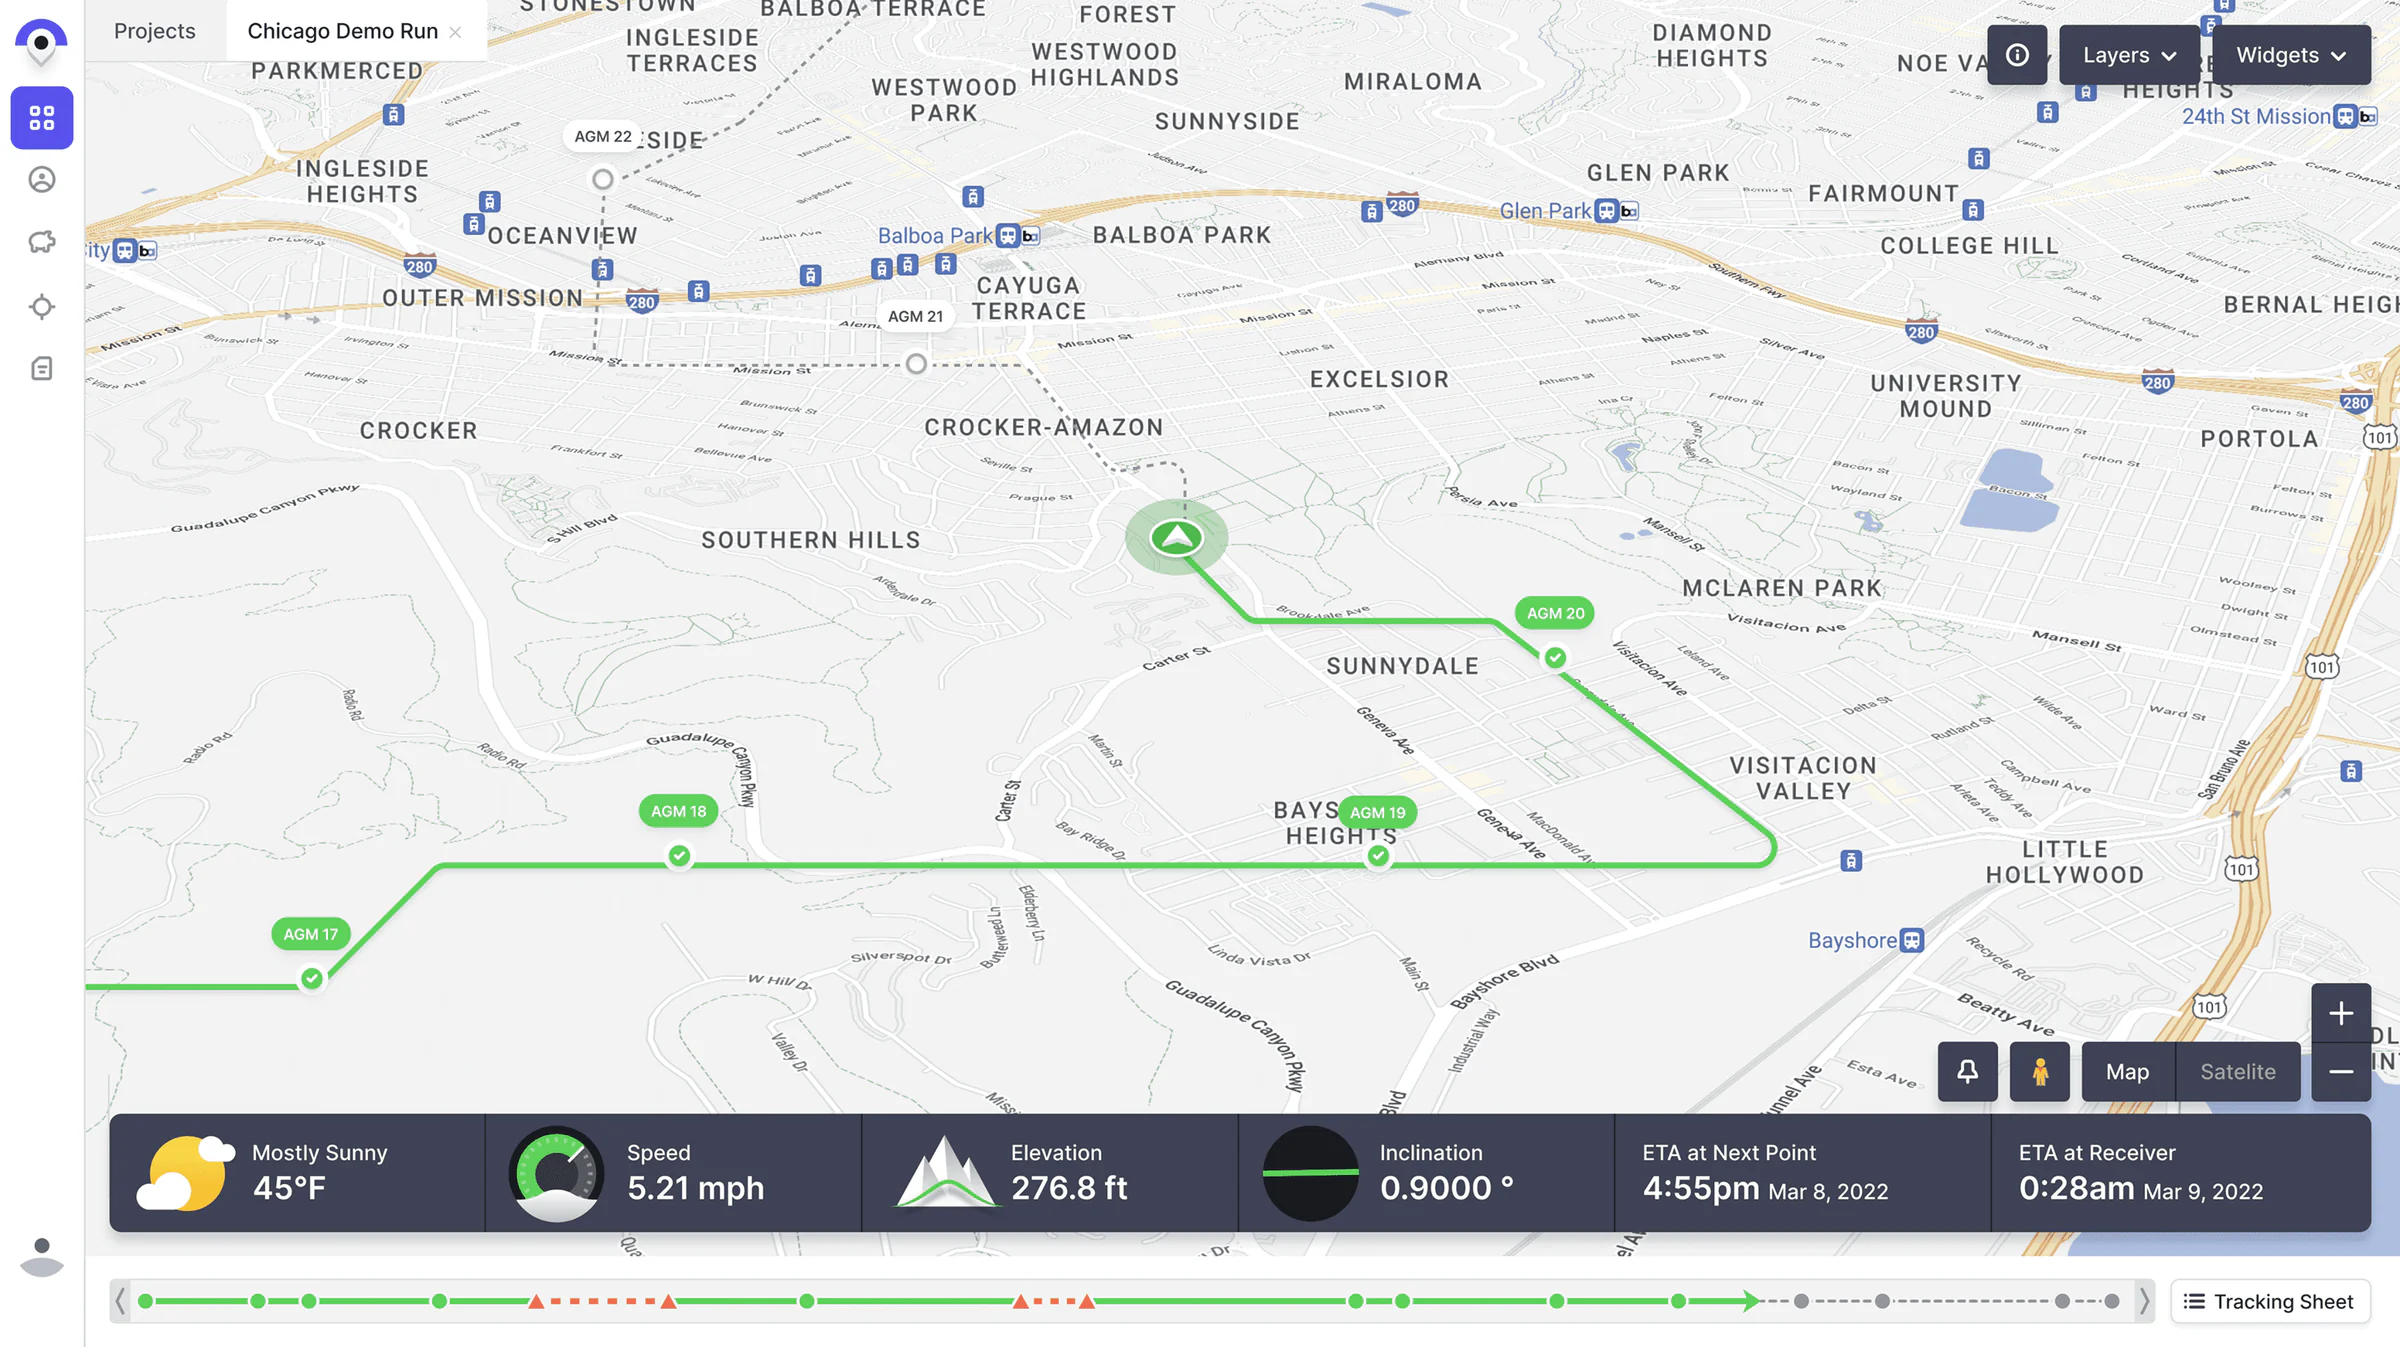
Pig Run
The live view of a single run — where the pig is, where it has been, and when it is due at the next marker.
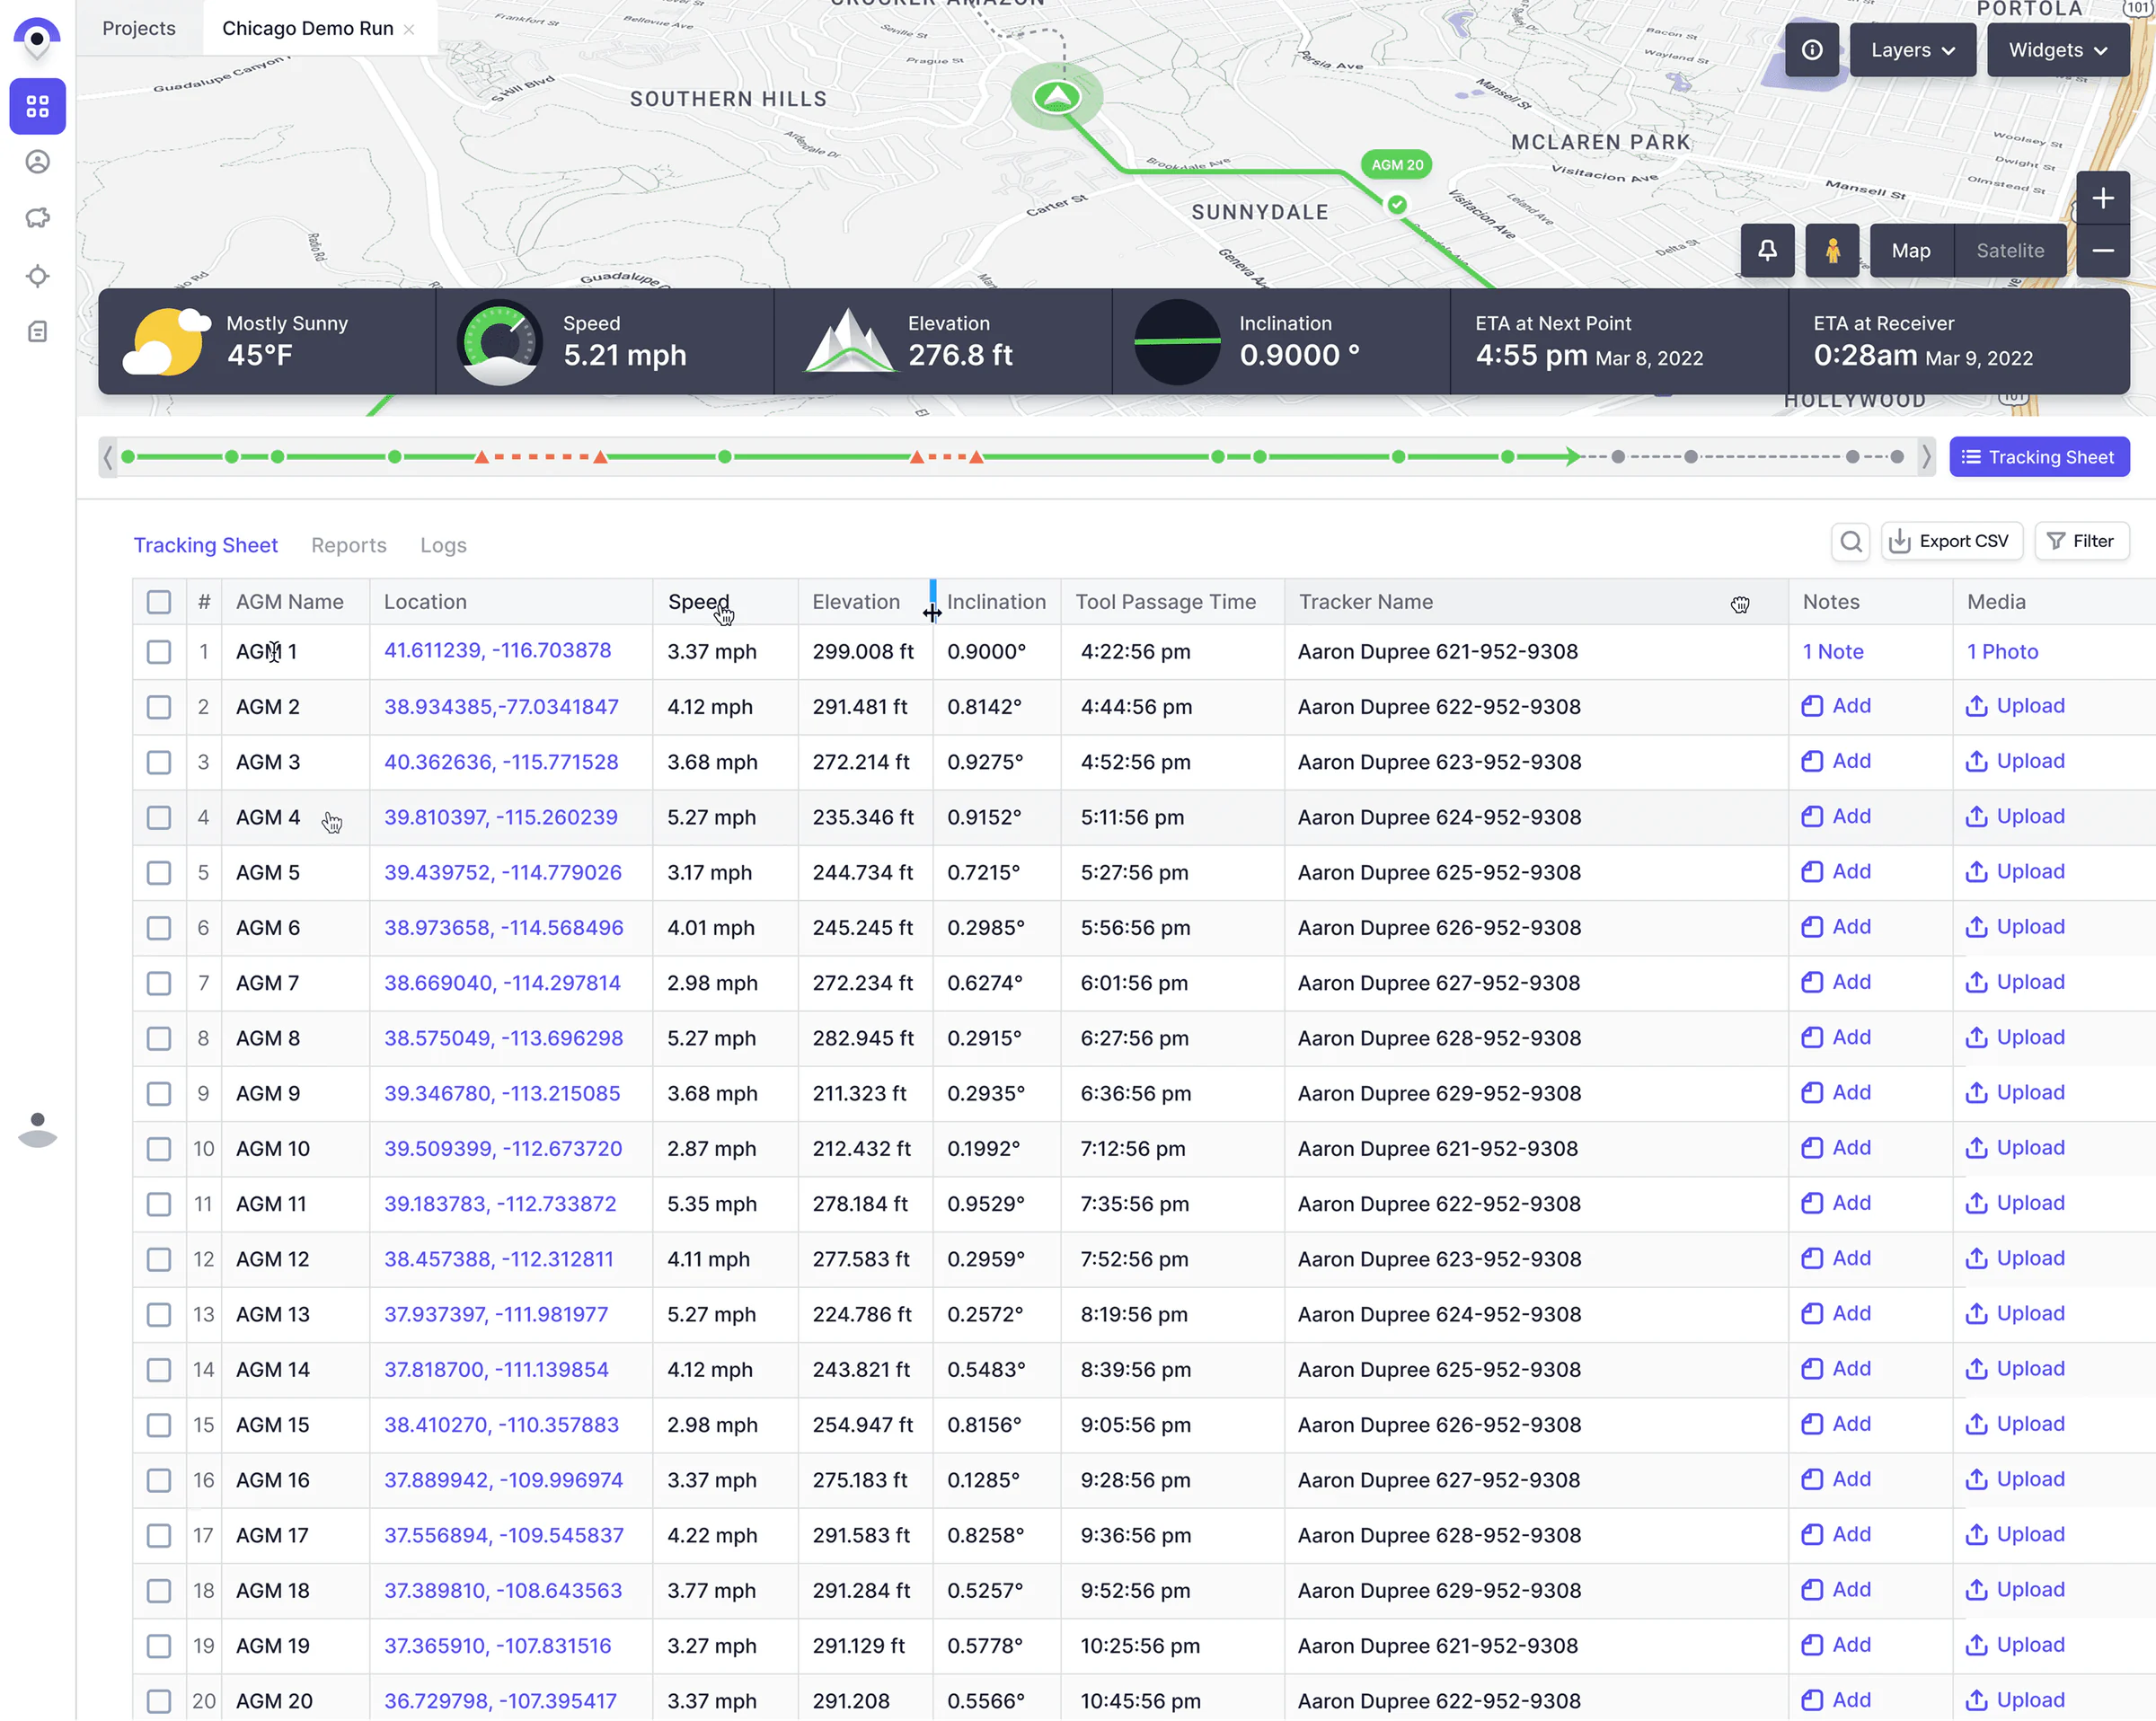
Pig run — tracking sheet
The tracking sheet is at the heart of GlobalTrack, containing survey data points in GPS coordinates, estimated arrival times, and links to work location photographs.
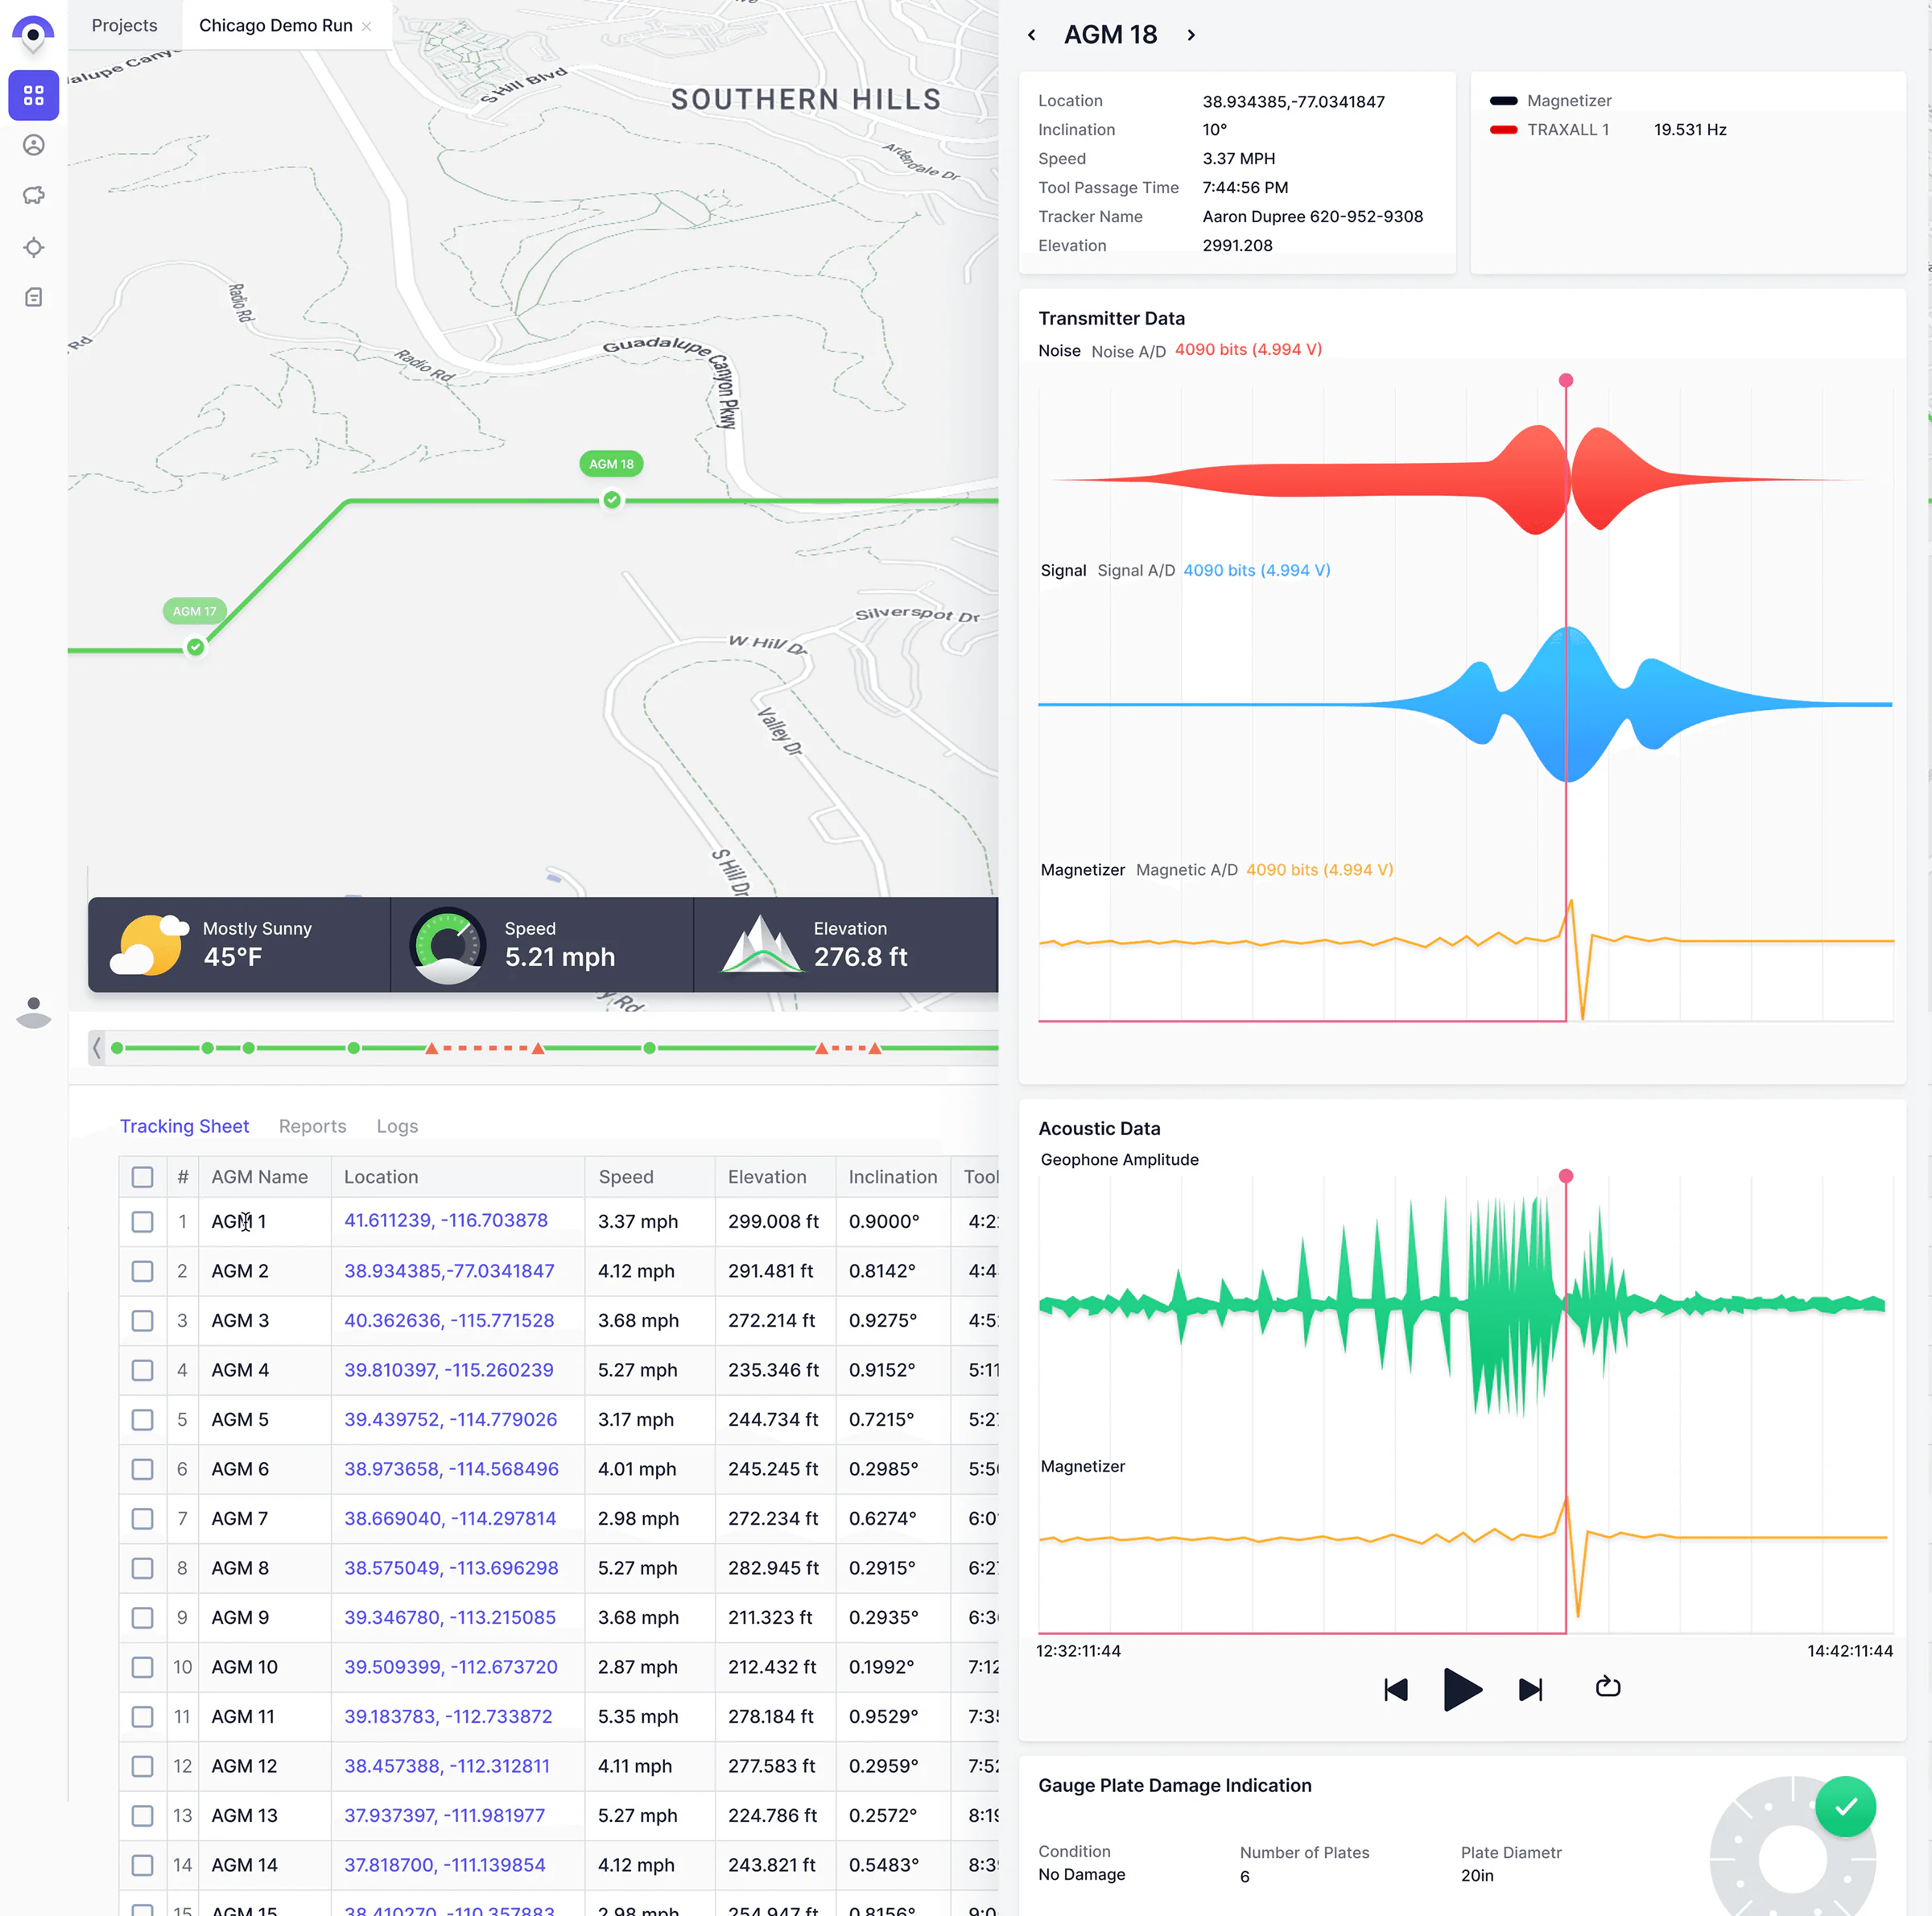
Pig run — AGM passage details
I designed a detailed view for Above-Ground Marker (AGM) passage data, showing critical technical information.
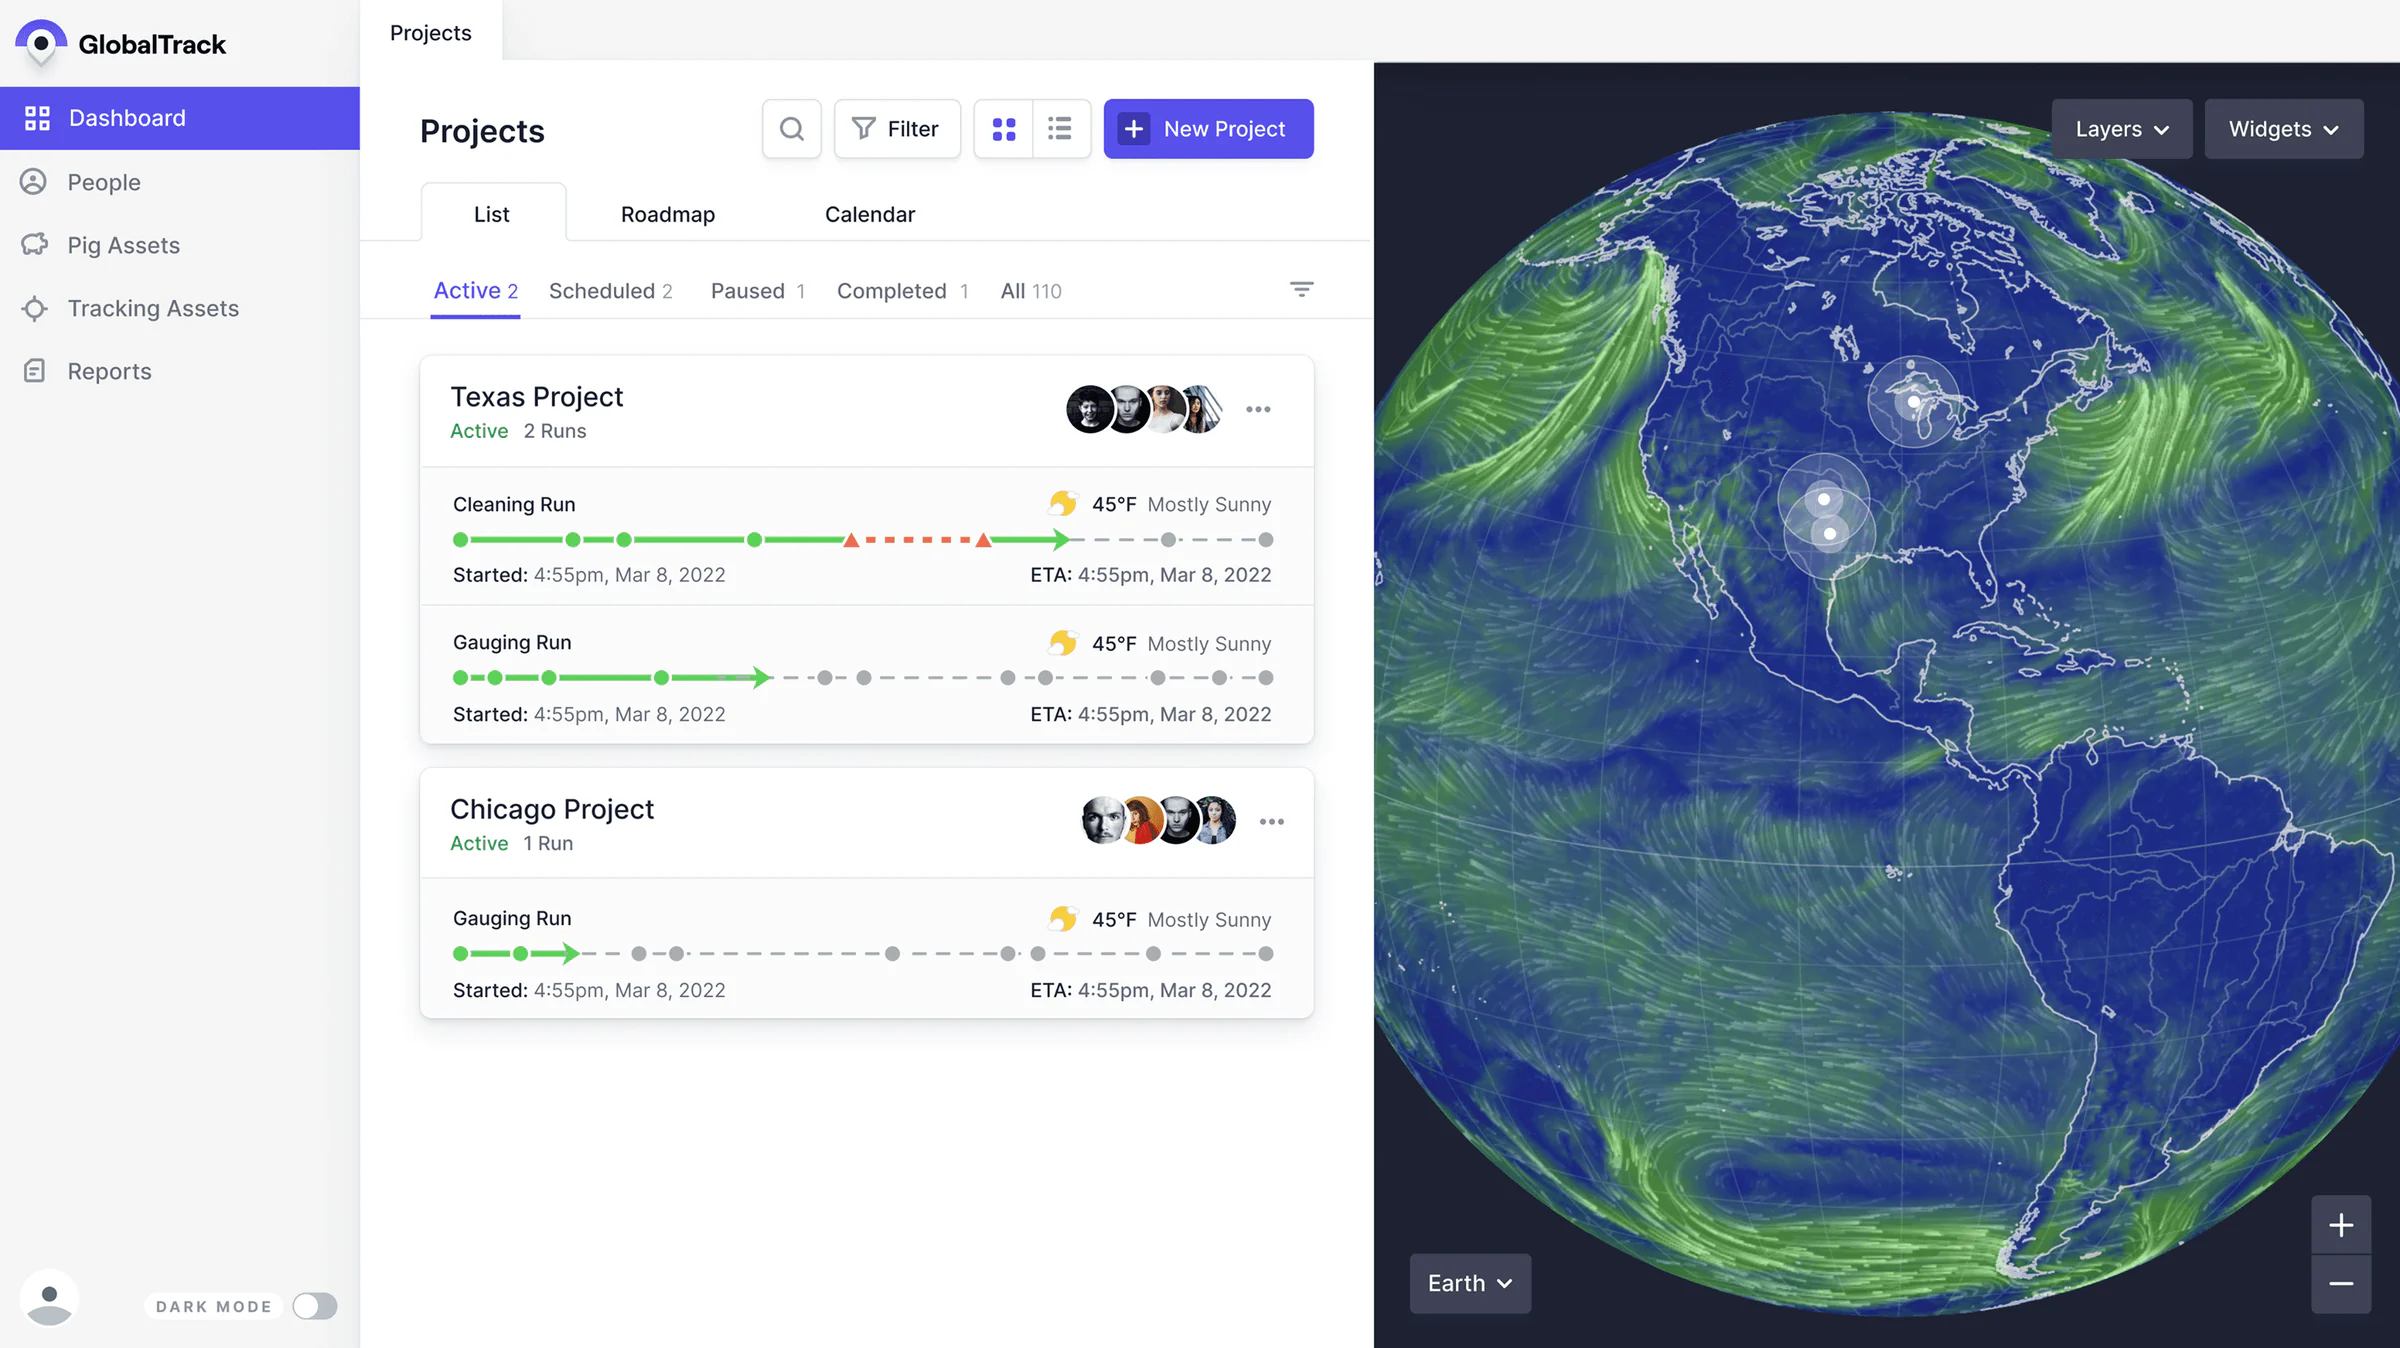
Projects dashboard
The dashboard provides a high-level view of all pipeline projects, displaying status, schedule, and key metrics.
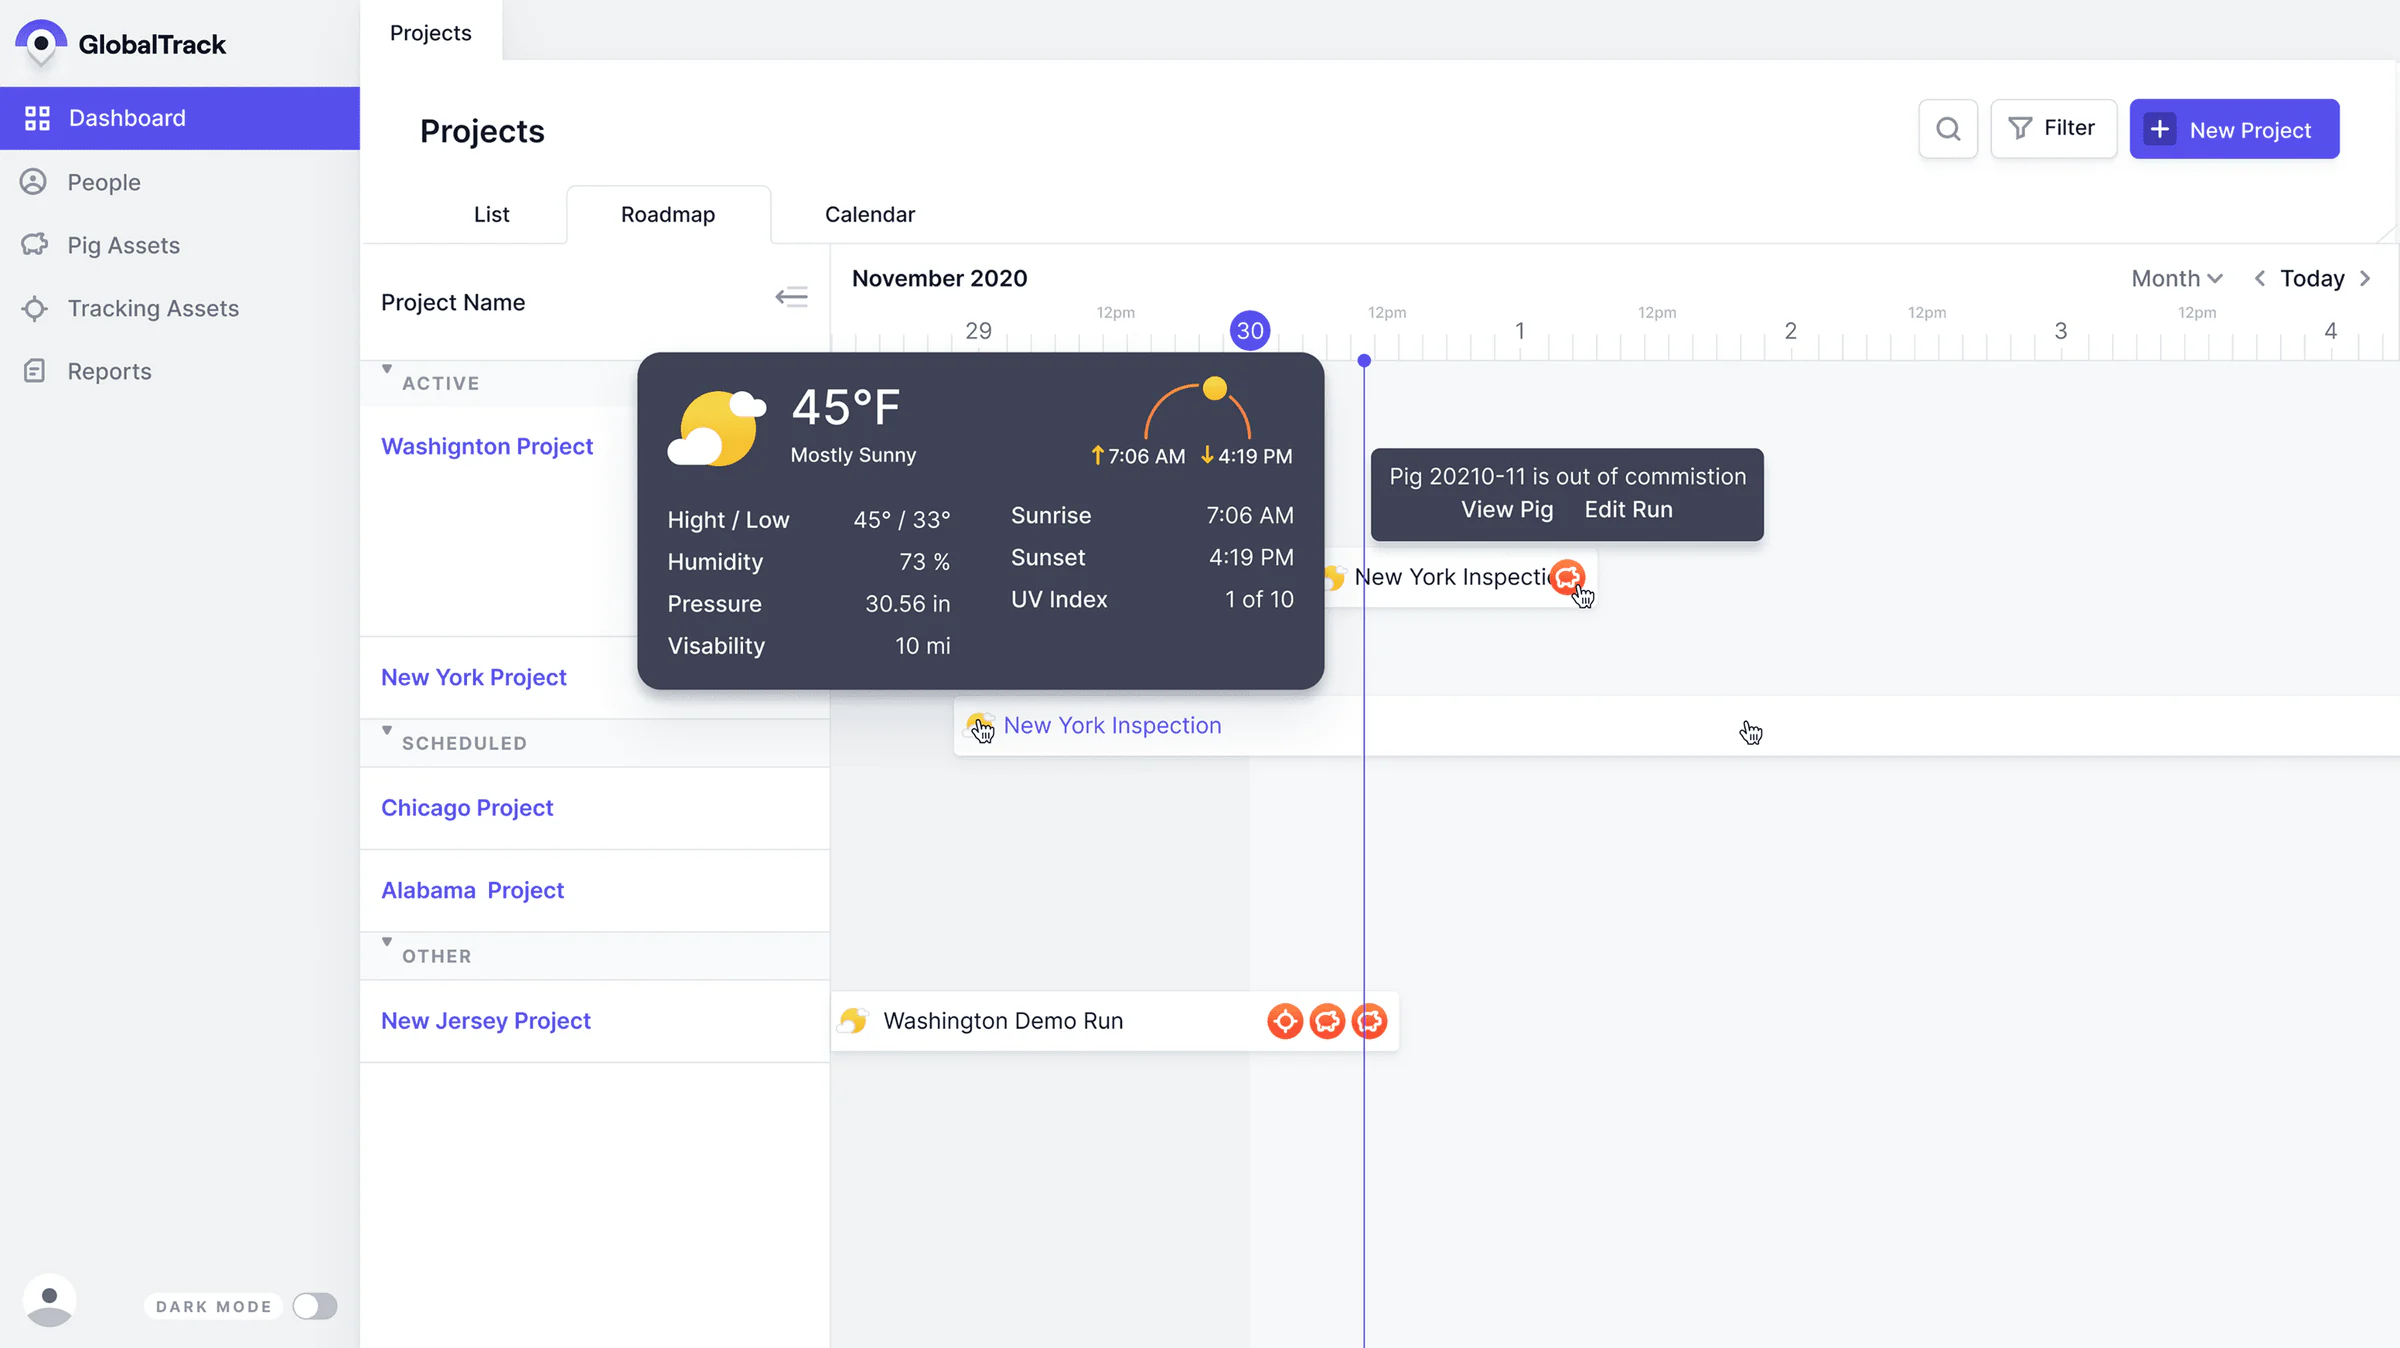
Projects roadmap
The dashboard overview gives a high-level view of the pipeline pig projects that are scheduled and ongoing, including a map that displays the projects, surveys, and runs.
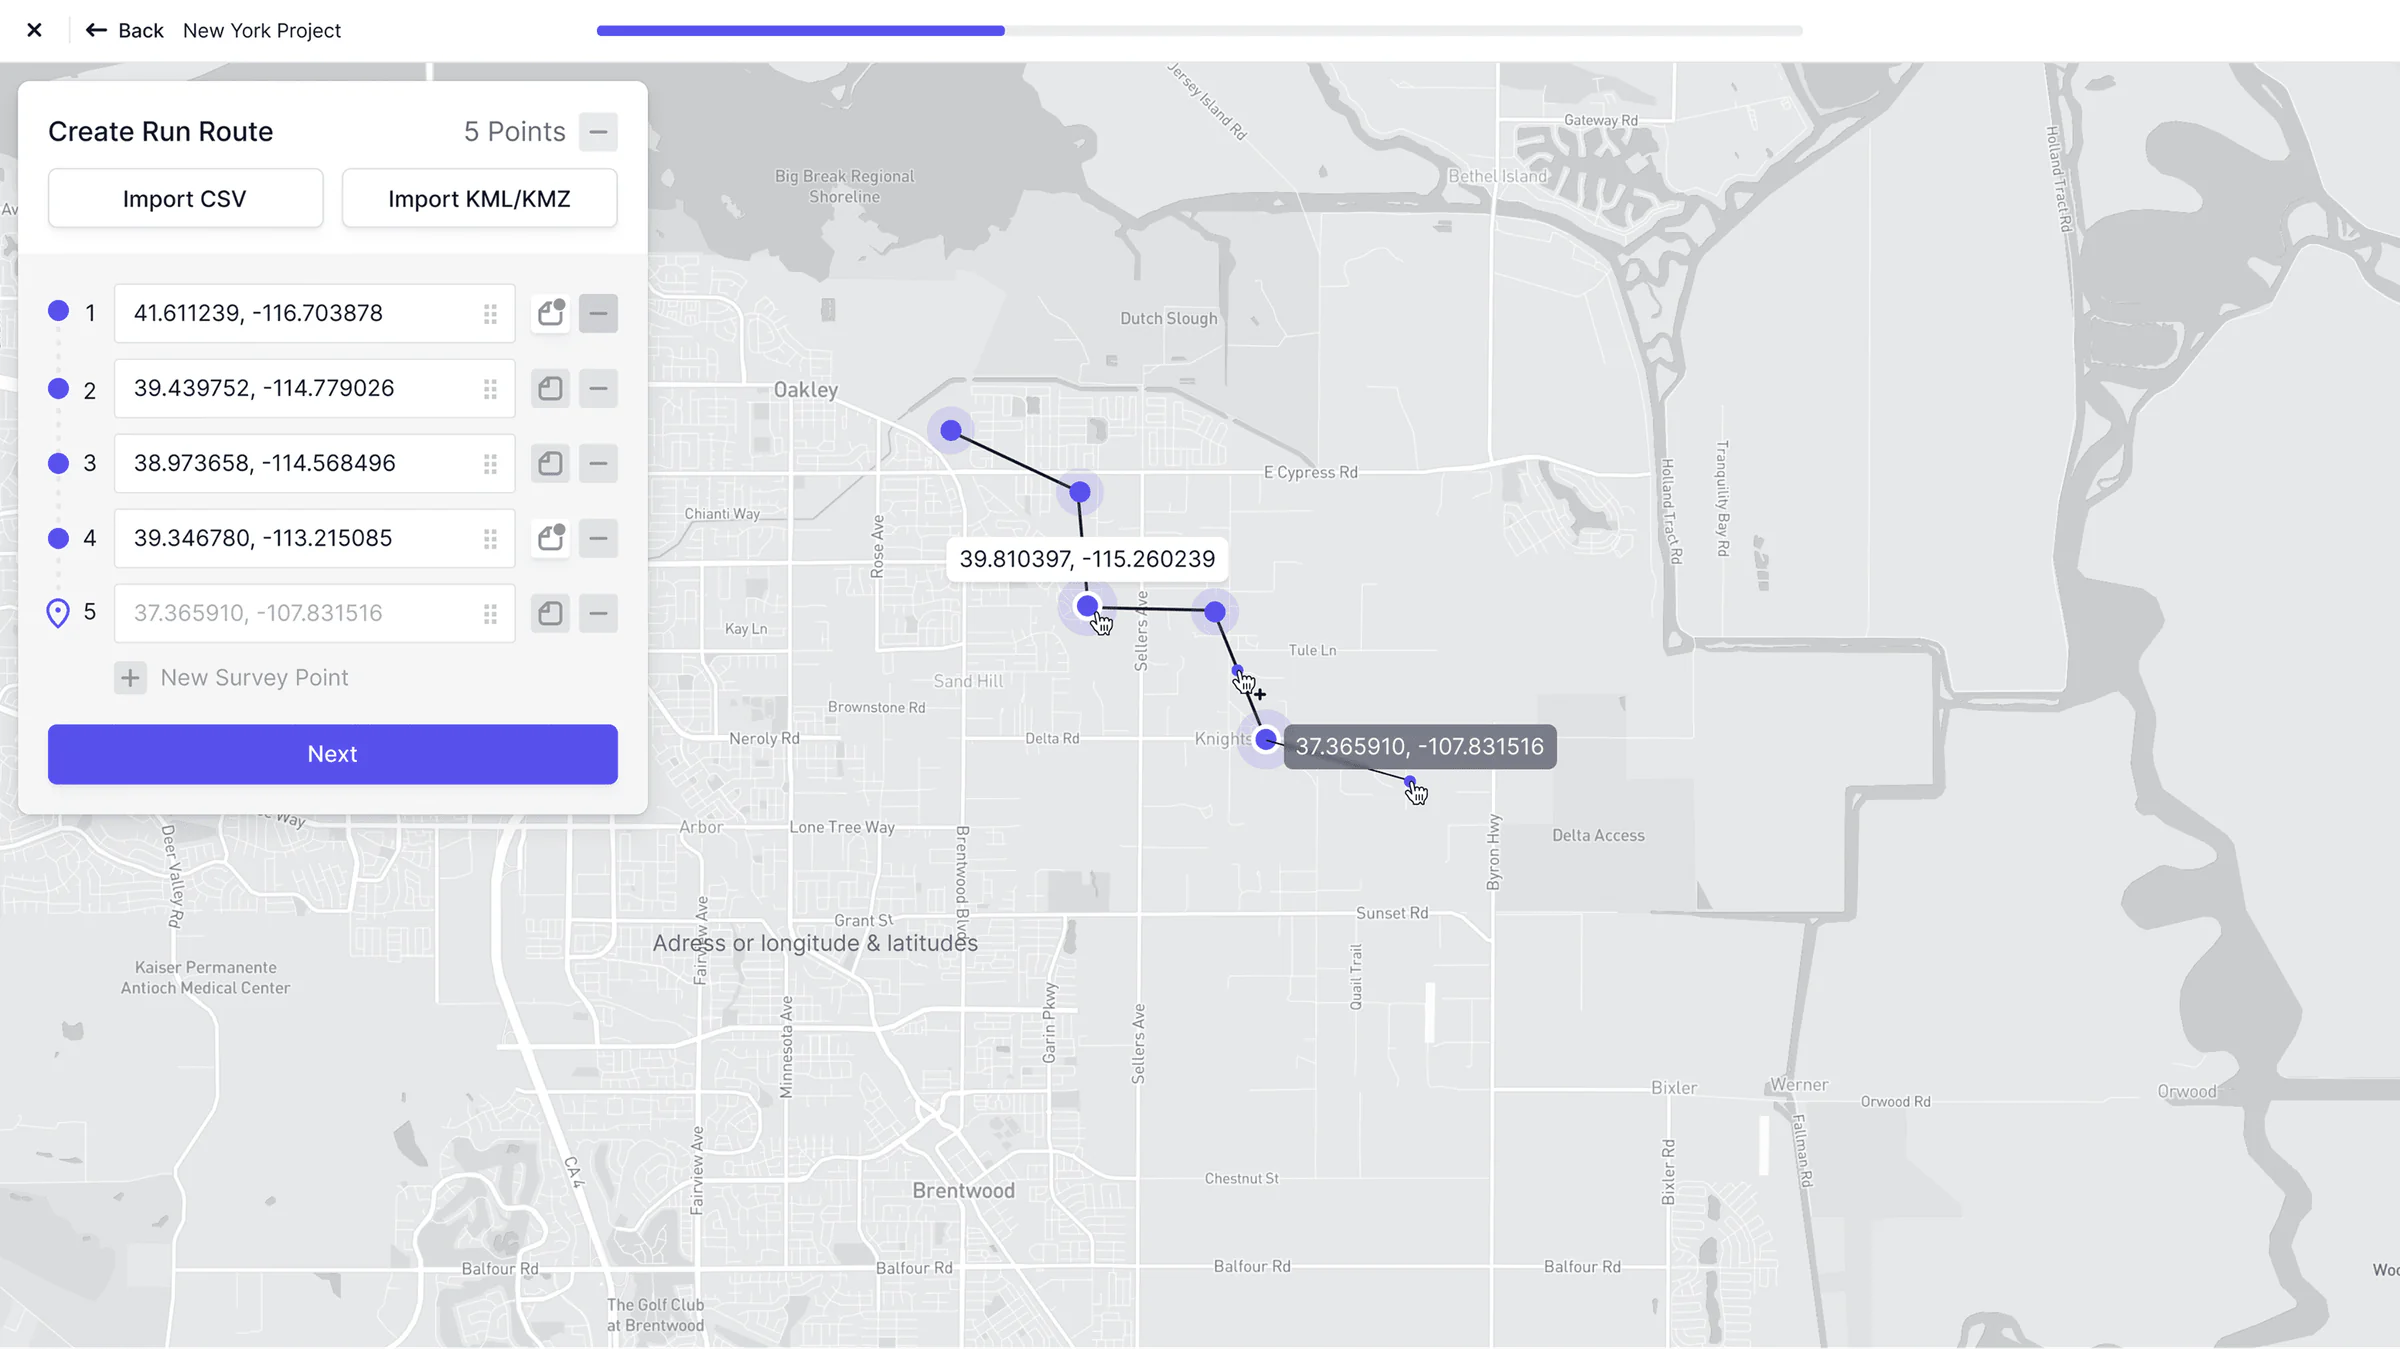
New project flow — create a route
A pipeline survey is the actual route the pig will take. These routes are created beforehand by the pipeline operator and input into the web app; they consist of GPS longitudes and latitudes.
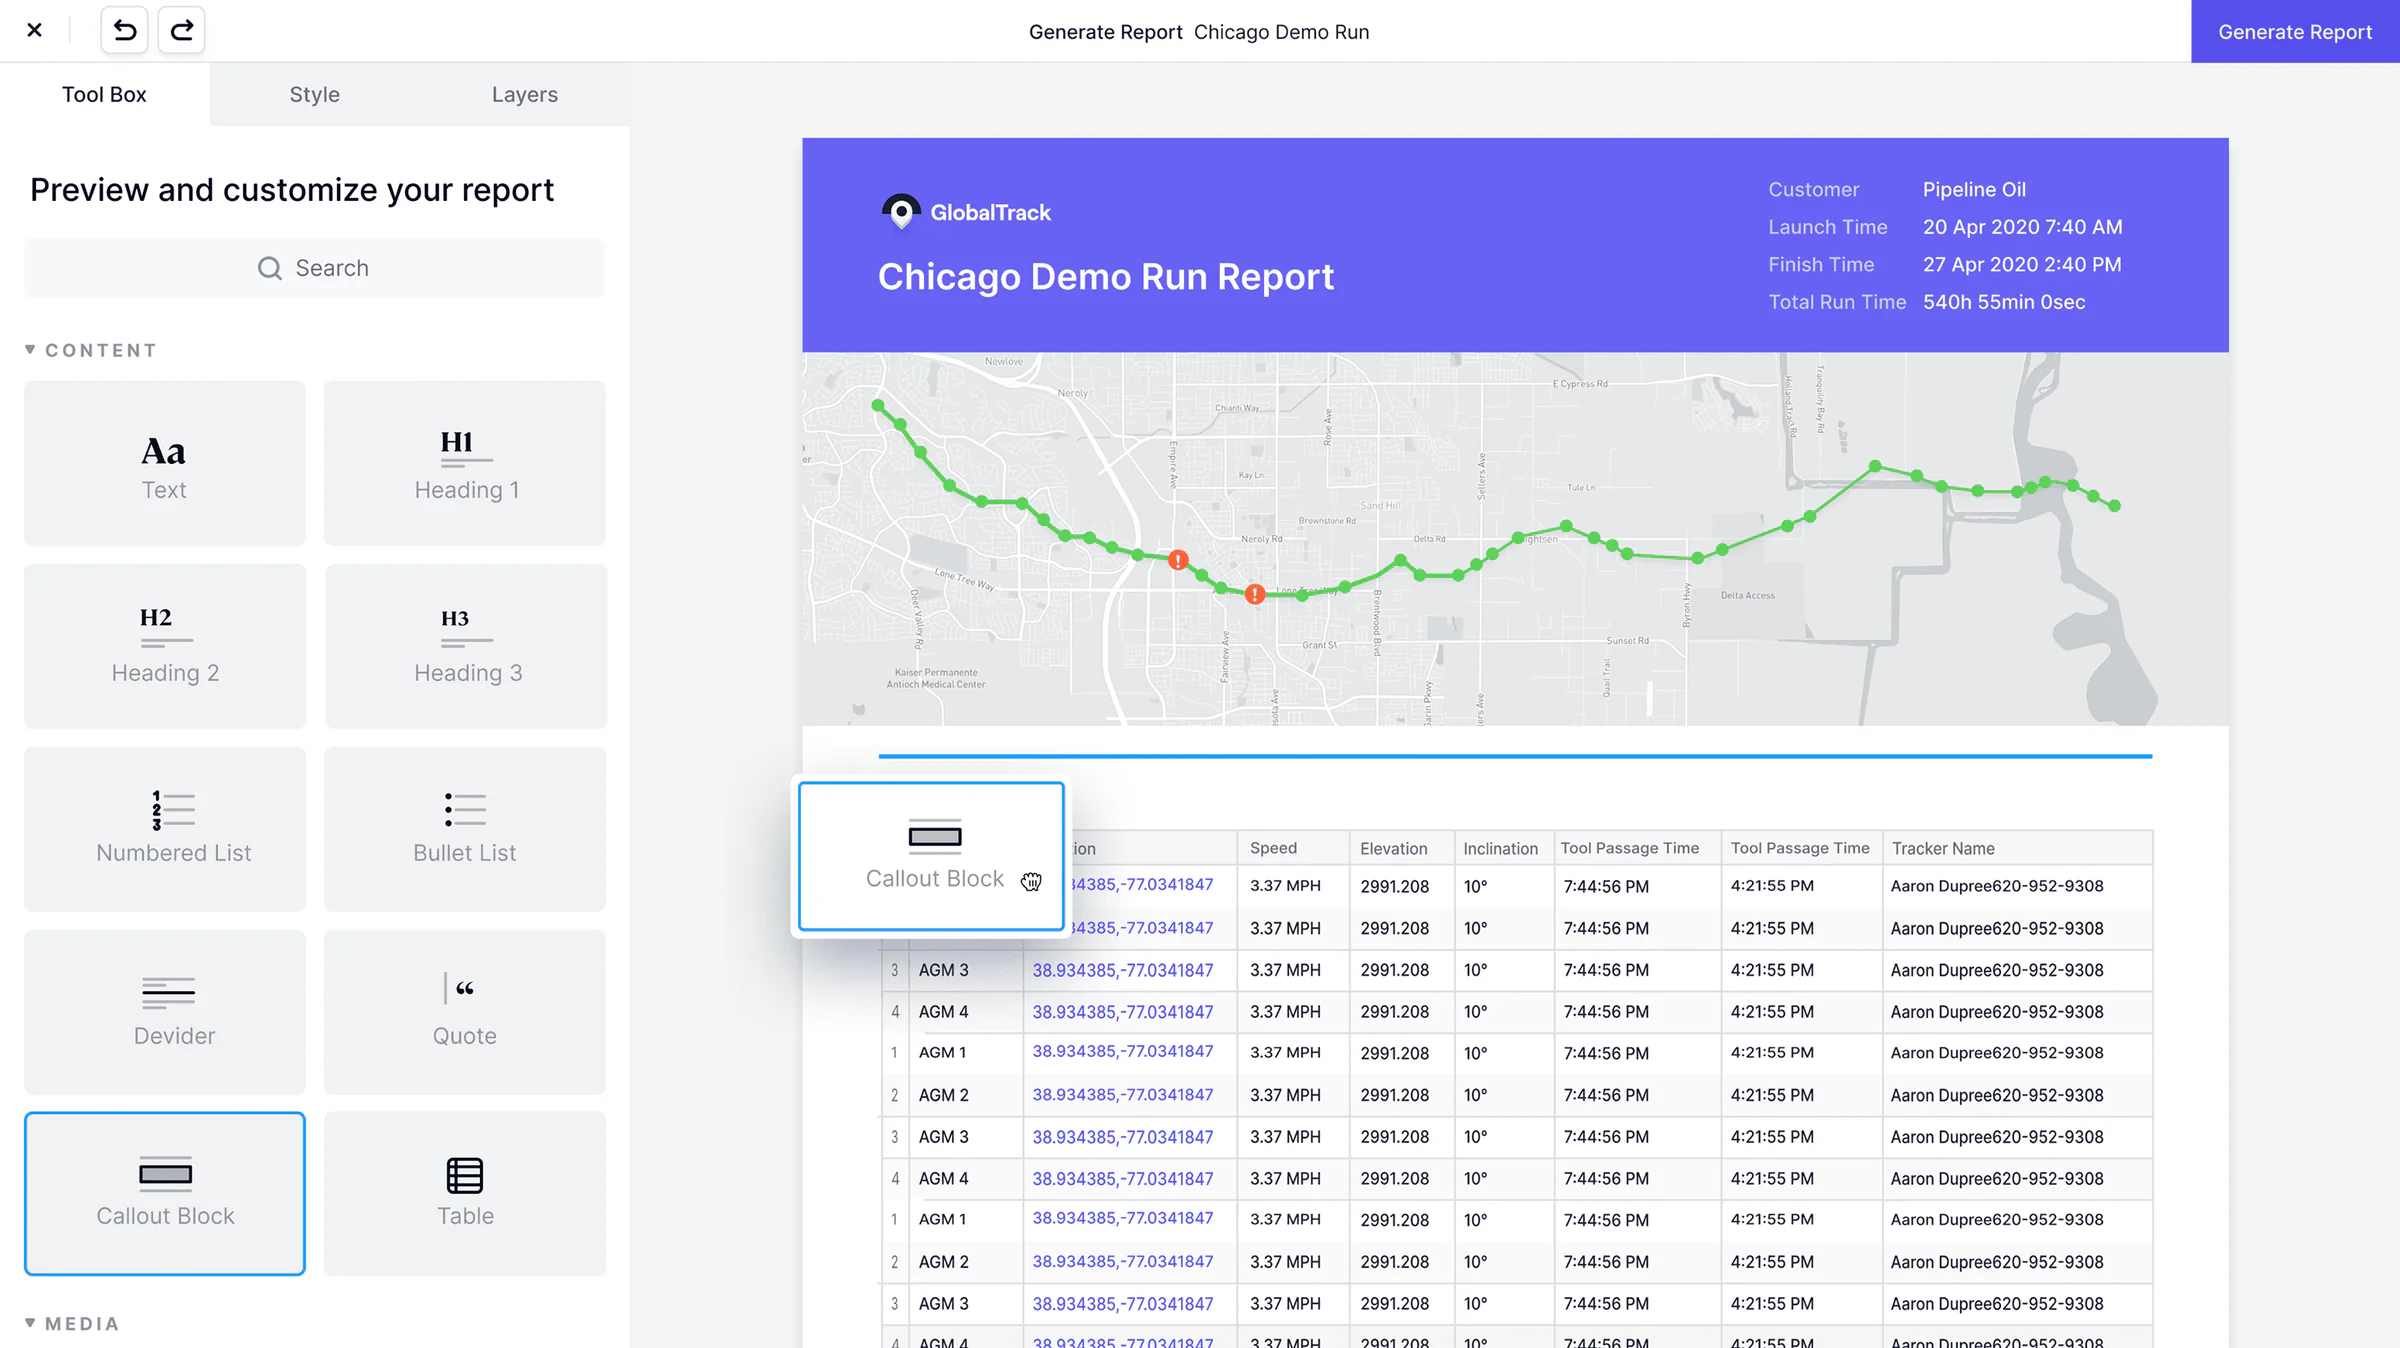
Custom reporting
All field activity data is compiled into client deliverables showing completed work. I designed a flexible reporting system that lets users create and customize reports for different stakeholders.
Lessons learned
- Early collaboration with engineering ensured smoother handoff and fewer implementation surprises.
- Choosing simpler UI solutions over complex interactions saved significant design and development time without compromising usability.
- Starting with a clear list of business needs helped focus ideation but required extra effort to balance with user-centered design.
- Field users prioritize reliability and simplicity — every design decision had to support confident use under pressure.
What I would do next
Personal growth
- Designing for environments with technical constraints.
- Creating systems that work seamlessly online and offline.
- Balancing business requirements with user needs.
- Collaborating effectively with cross-functional teams.
Where the product goes
- Machine Learning: Exploring AI-powered anomaly detection.
- Integration Ecosystem: Developing APIs for third-party system integration.
- Mobile Optimization: Enhancing the mobile experience for field teams.
- Advanced Analytics: Implementing predictive maintenance capabilities.